Why QuickBooks users need Google Sheets
QuickBooks Online is an excellent accounting solution from Intuit, but even the most powerful financial tools have limitations. For many businesses, QuickBooks reports and native reporting capabilities don't provide the flexibility needed for comprehensive financial data analysis.
While QBO offers numerous pre-built reports, many QuickBooks users find these reports restrictive for several reasons:
- Limited customization options: QuickBooks Online allows basic customization of reports, but you can't easily create complex custom calculations or unique visualizations
- Rigid filtering capabilities: Creating multi-dimensional filters (like analyzing sales across locations, product categories, and due date ranges simultaneously) requires workarounds
- Performance issues with large datasets: As businesses grow, QuickBooks data often becomes too extensive for efficient analysis, leading to slow performance when dealing with numerous journal entries
- Restricted sharing and collaboration: Sharing financial dashboards with team members who don't have QuickBooks Online Accountant access is cumbersome
Why is connecting to Google Sheets the go-to solution
Business users, bookkeepers, and accountants turn to Google Sheets to overcome these limitations for several compelling reasons:
- Unmatched flexibility: Create custom calculations using powerful functions, unique visualizations, and tailored reports that precisely match your business needs.
- Real-time collaboration: Multiple team members can work simultaneously on the same financial data without version control issues through Google Workspace
- Powerful data analysis: Leverage Google Sheets' built-in functions, pivot tables, and charts to gain deeper insights from your financial data.
- Seamless integration: Connect your QuickBooks data with information from other business systems for comprehensive analysis.
Manually exporting data from QuickBooks Online to Google Sheets is time-consuming and error-prone. This is where Coupler.io comes in as the perfect bridge between these two powerful platforms. It allows you to automate reporting by creating a Google Sheets integration that keeps your financial data up-to-date without manual intervention.
How to export QuickBooks data to Google Sheets
Setting up a connection between QuickBooks and Google Sheets with Coupler.io is straightforward. First, you need to sign up - you can do this for free with no credit card required. From your Coupler.io dashboard, click Create new data flow.
Then, you can choose from two options for creating a data flow:
- From scratch - to select your data sources and configure data transformations on your own
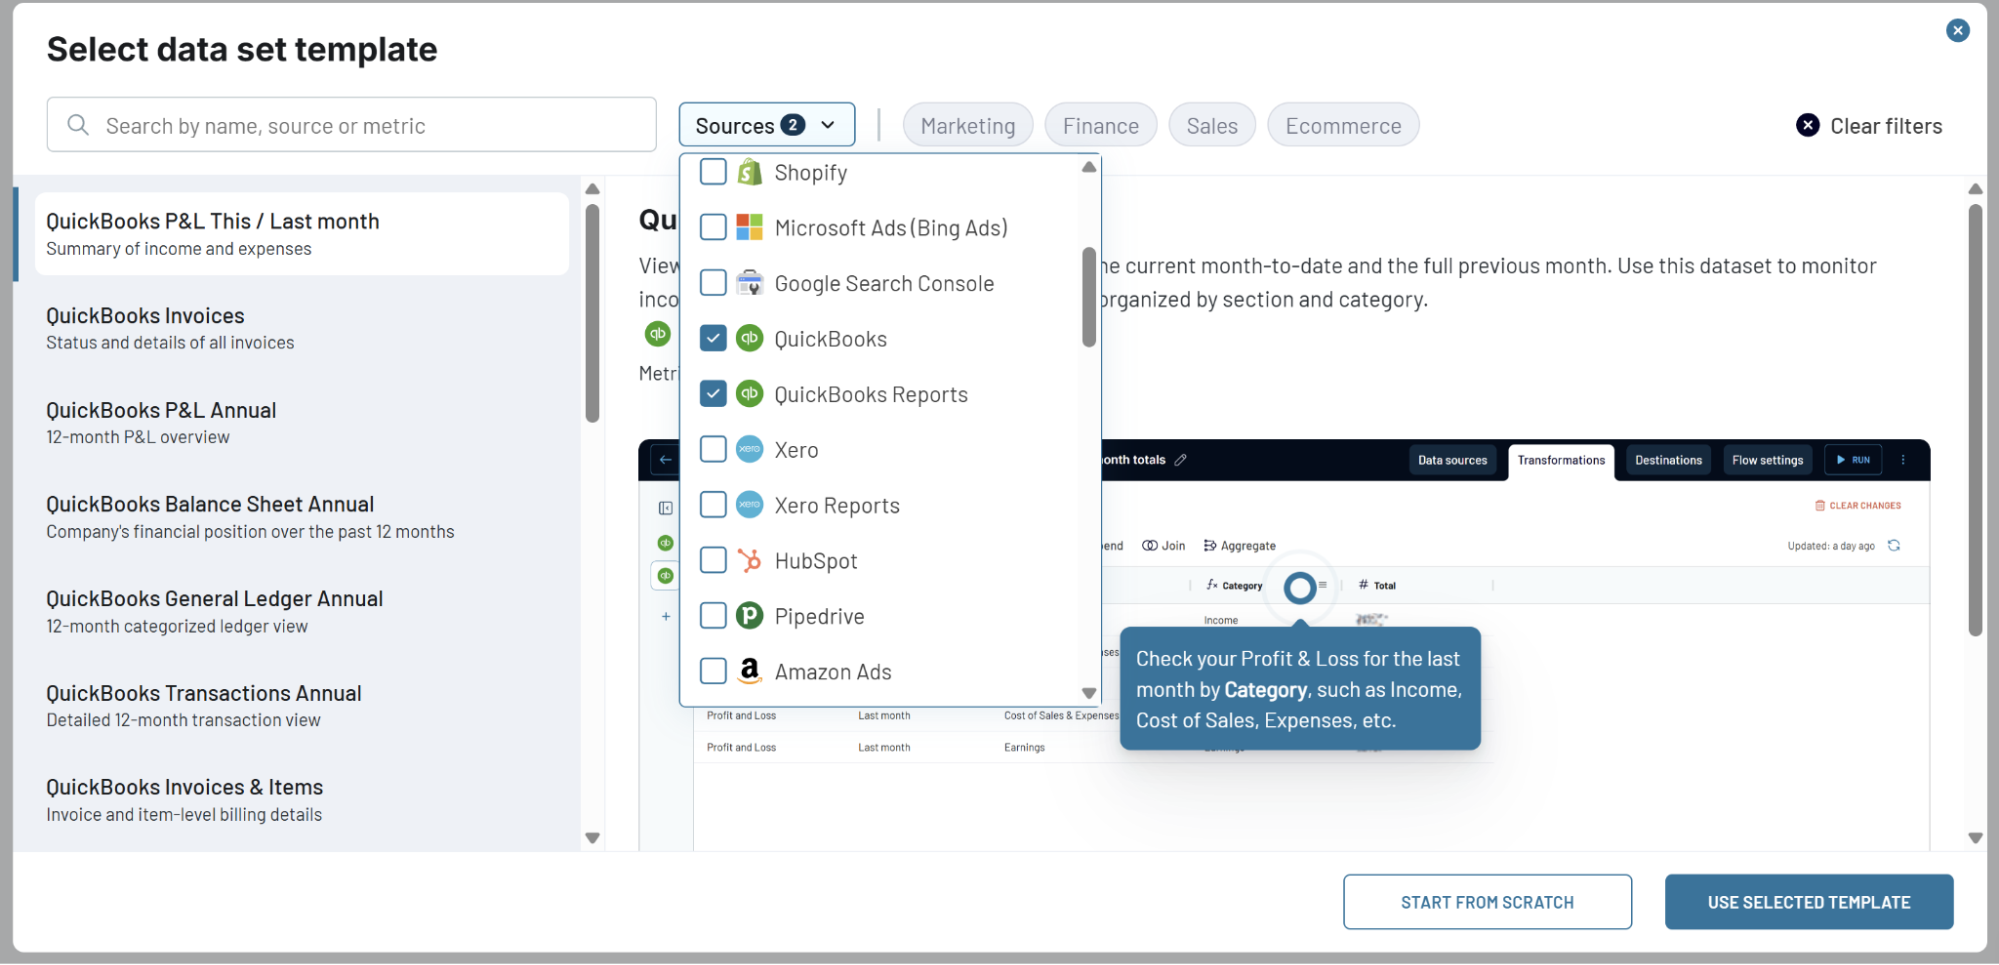
- From a prebuilt data set template - to use a ready-made reporting solution designed by Coupler.io's data analysts for common business scenarios.
Once you click From scratch, you'll need to select a data source(s) to export data from. Coupler.io provides two options for exporting data from QuickBooks Online:
- QuickBooks to export raw data like invoices, bills, customers, payments, etc.
- QuickBooks Reports to export pre-formatted reports like Balance Sheet, Profit & Loss, AP/AR Aging, Cash Flow, etc..
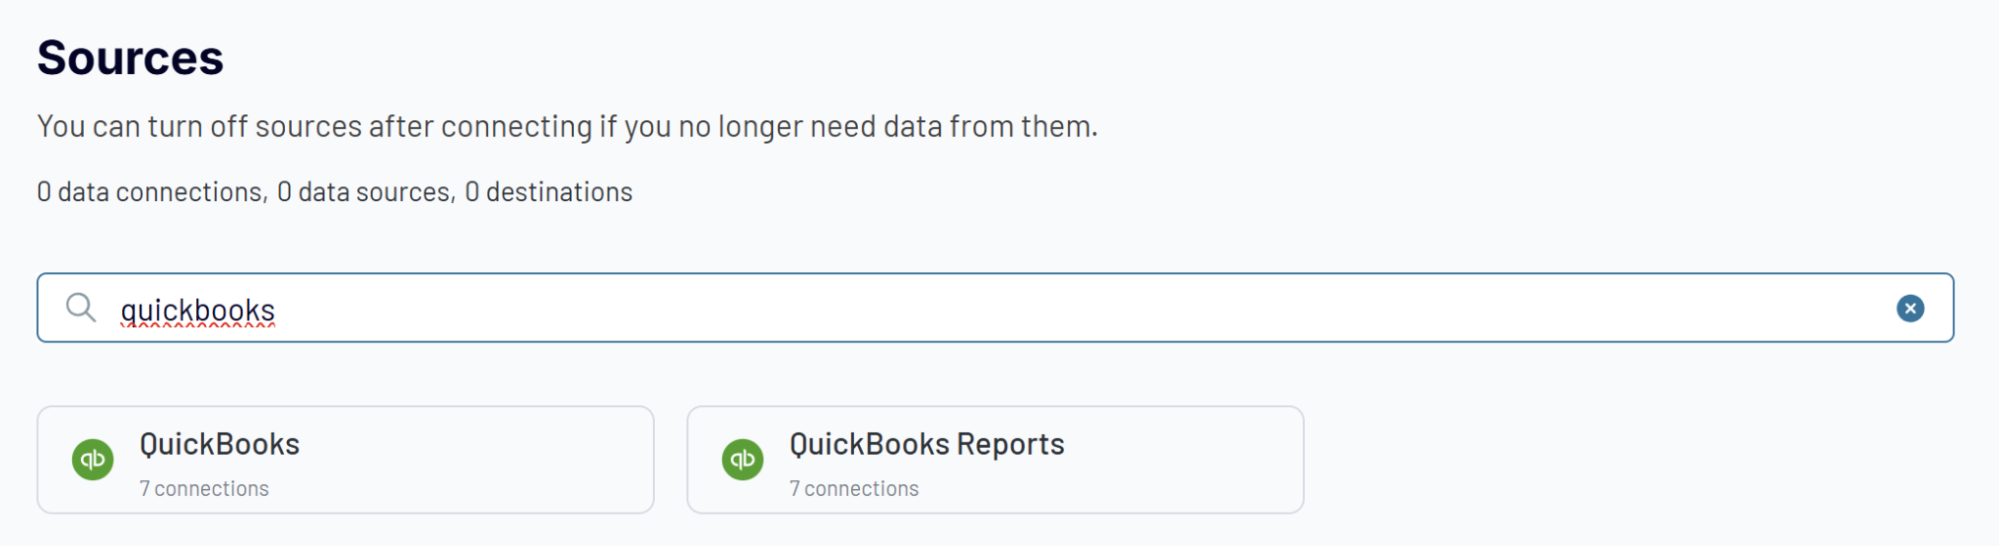
Choose the option you need, and complete the following steps:
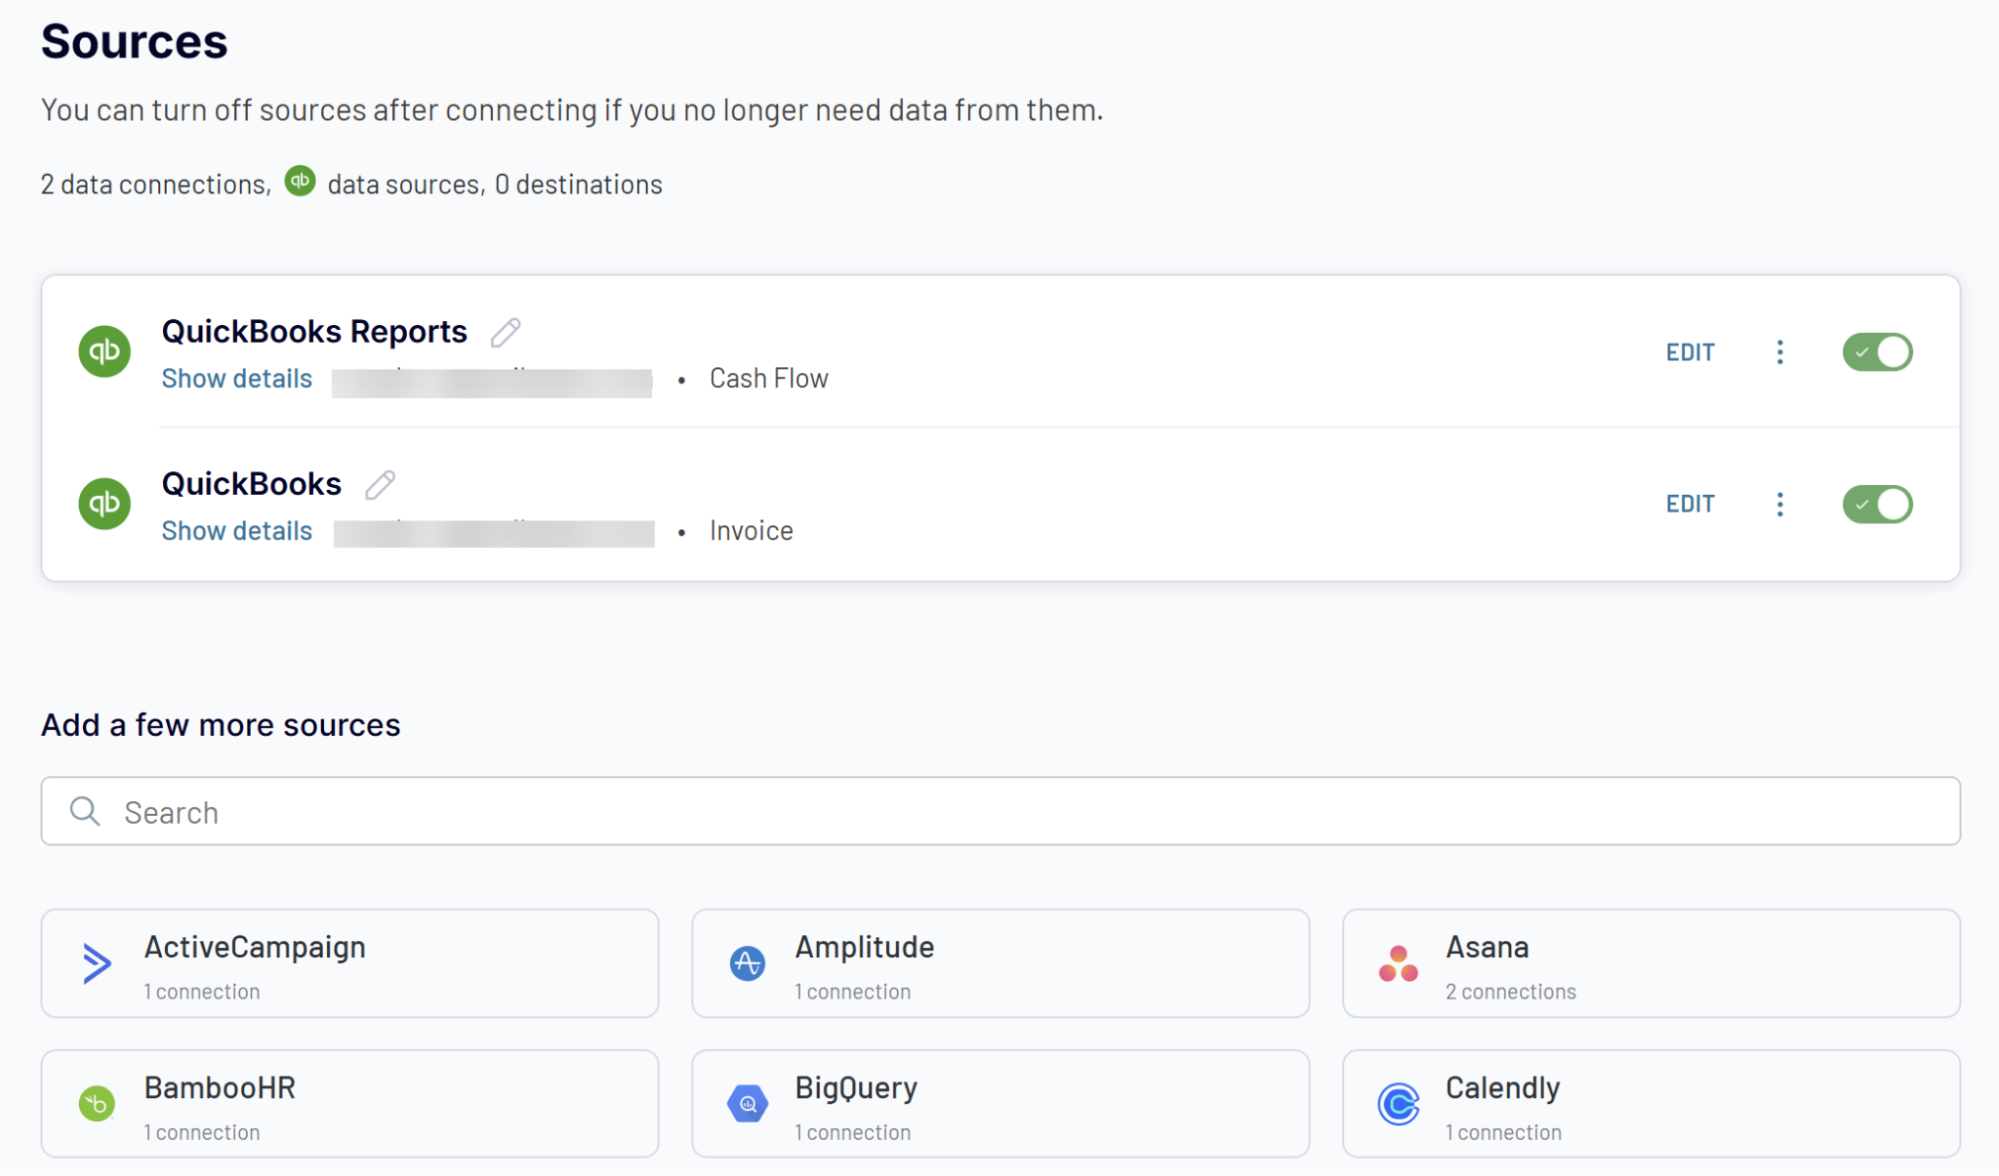
1. Connect your QuickBooks Online account
- Whether you've select QuickBooks or QuickBooks Reports as your data source, connect your QuickBooks Online account by authorizing the integration with appropriate permissions.
- Then choose the data you want to load to Google Sheets from the list of data entities (Invoices, Bills, Customers, etc.) or reports (Balance Sheets, Cash Flow, etc.)

Depending on the chosen data, you may need to fill out optional fields like the Report period.
Note: Coupler.io allows you to connect multiple data sources within one data flow. This allows you to import data from multiple QuickBooks data entities, reports, or even combine QB data with information from other tools, like CRMs.
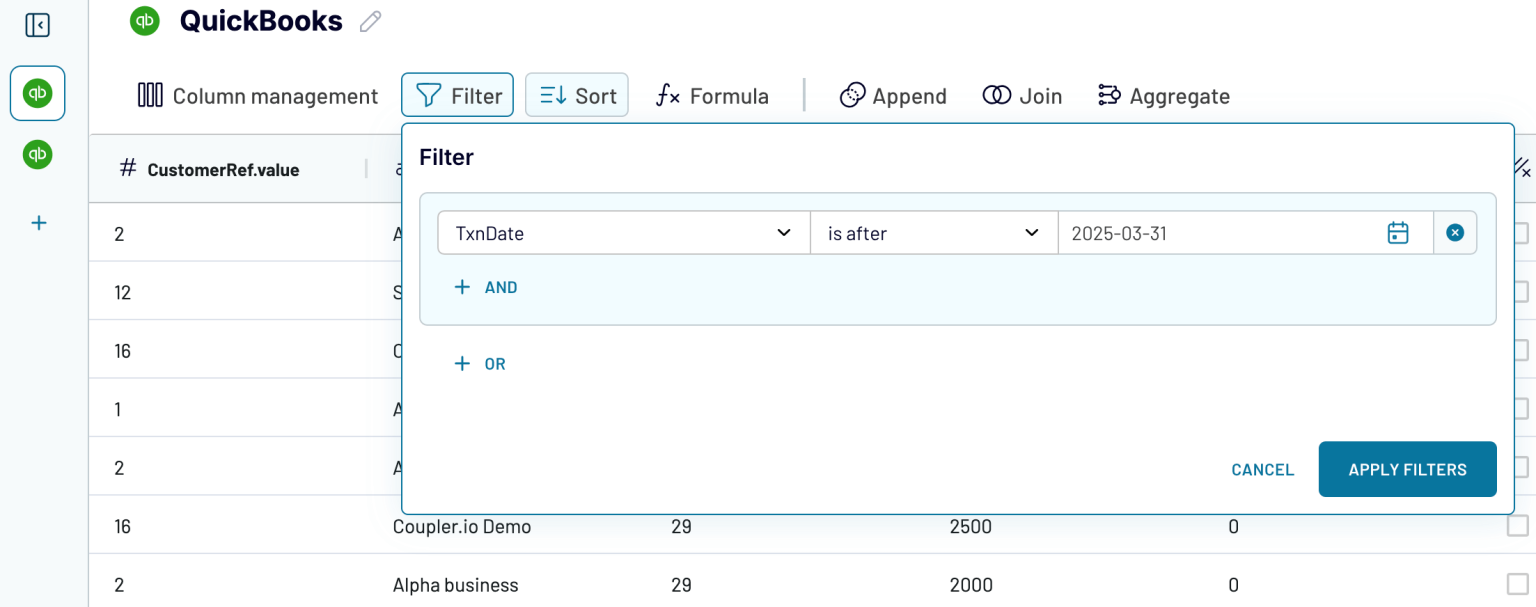
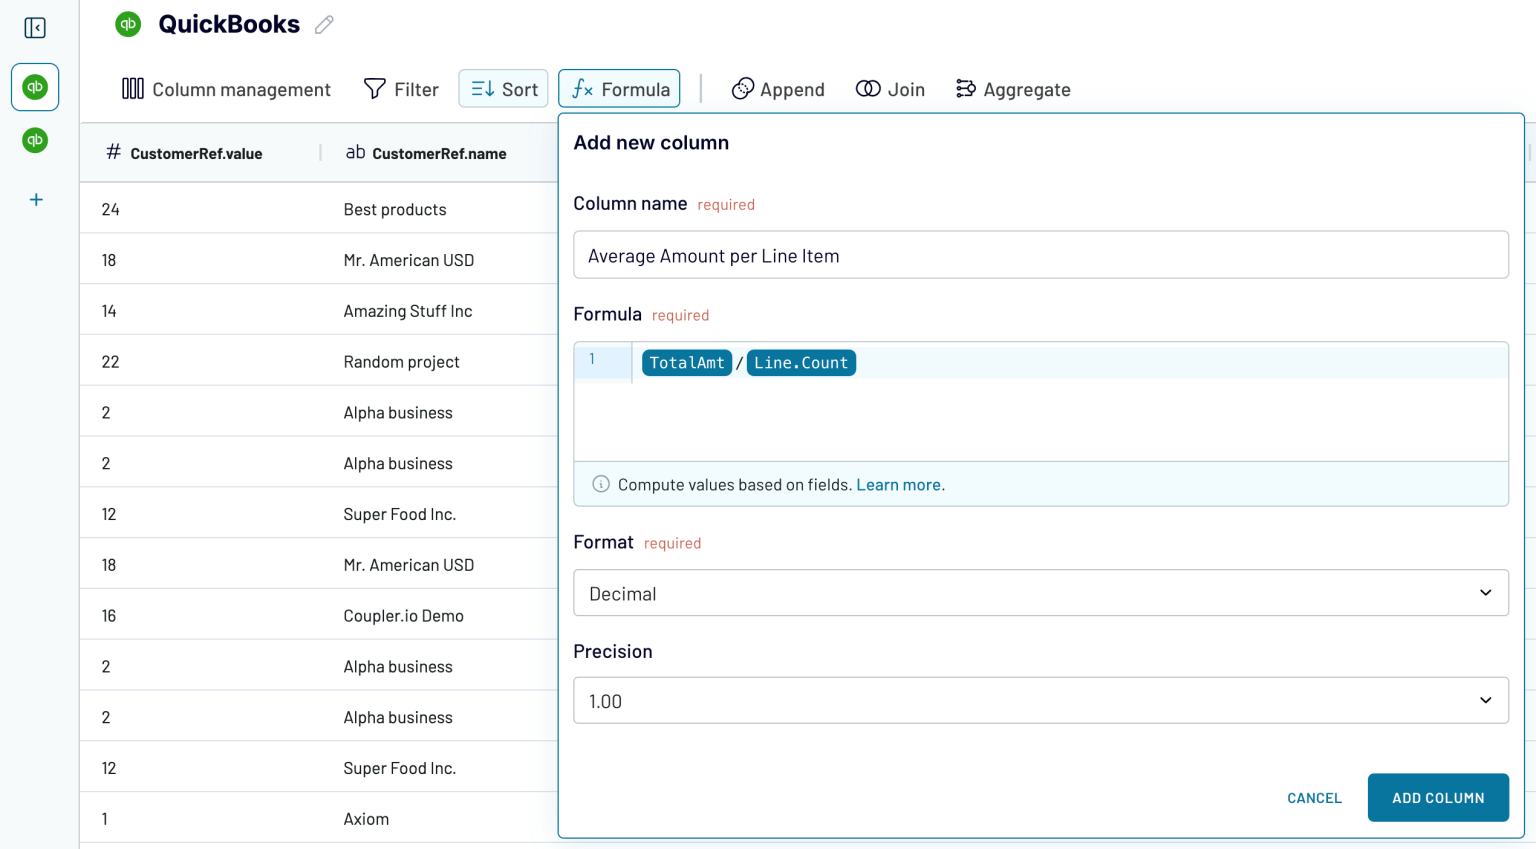
2. Configure data set transformation
In the next step, you can make your QuickBooks data analysis-ready before it reaches Google Sheets:
- Rename columns for clarity (e.g., change "TotalAmt" to "Total Amount")
- Hide unnecessary columns to optimize your view
- Apply filters to focus on specific time periods or data segments
- Create calculated fields using custom formulas
- Aggregate data using operations like sum, avg., count, min., or max. For example, you can sum up the payment amounts
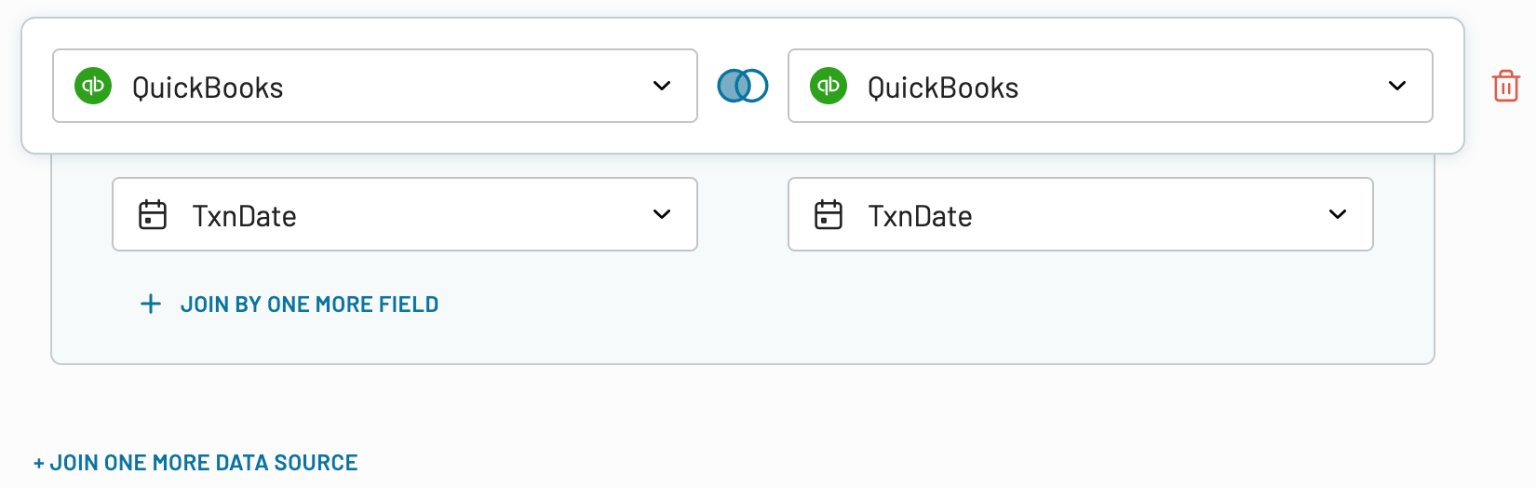
- If you've previously connected several sources you can also blend data:
- Append: merge datasets with similar structures and columns matched by name.
- Join: combine datasets with different structures and at least one matching column.
3. Load data to Google Sheets
- Select Google Sheets as your destination. If you have created multiple views of your QuickBooks data, like separate connected sources, aggregations, or combined data sets, choose one view to load to Google Sheets.
- Connect your Google Sheets account, and select a specific spreadsheet from your GDrive and a sheet where to load data. You can select an existing sheet or create a new one by typing in a new name.


4. Run your data flow and set up an automatic refresh schedule
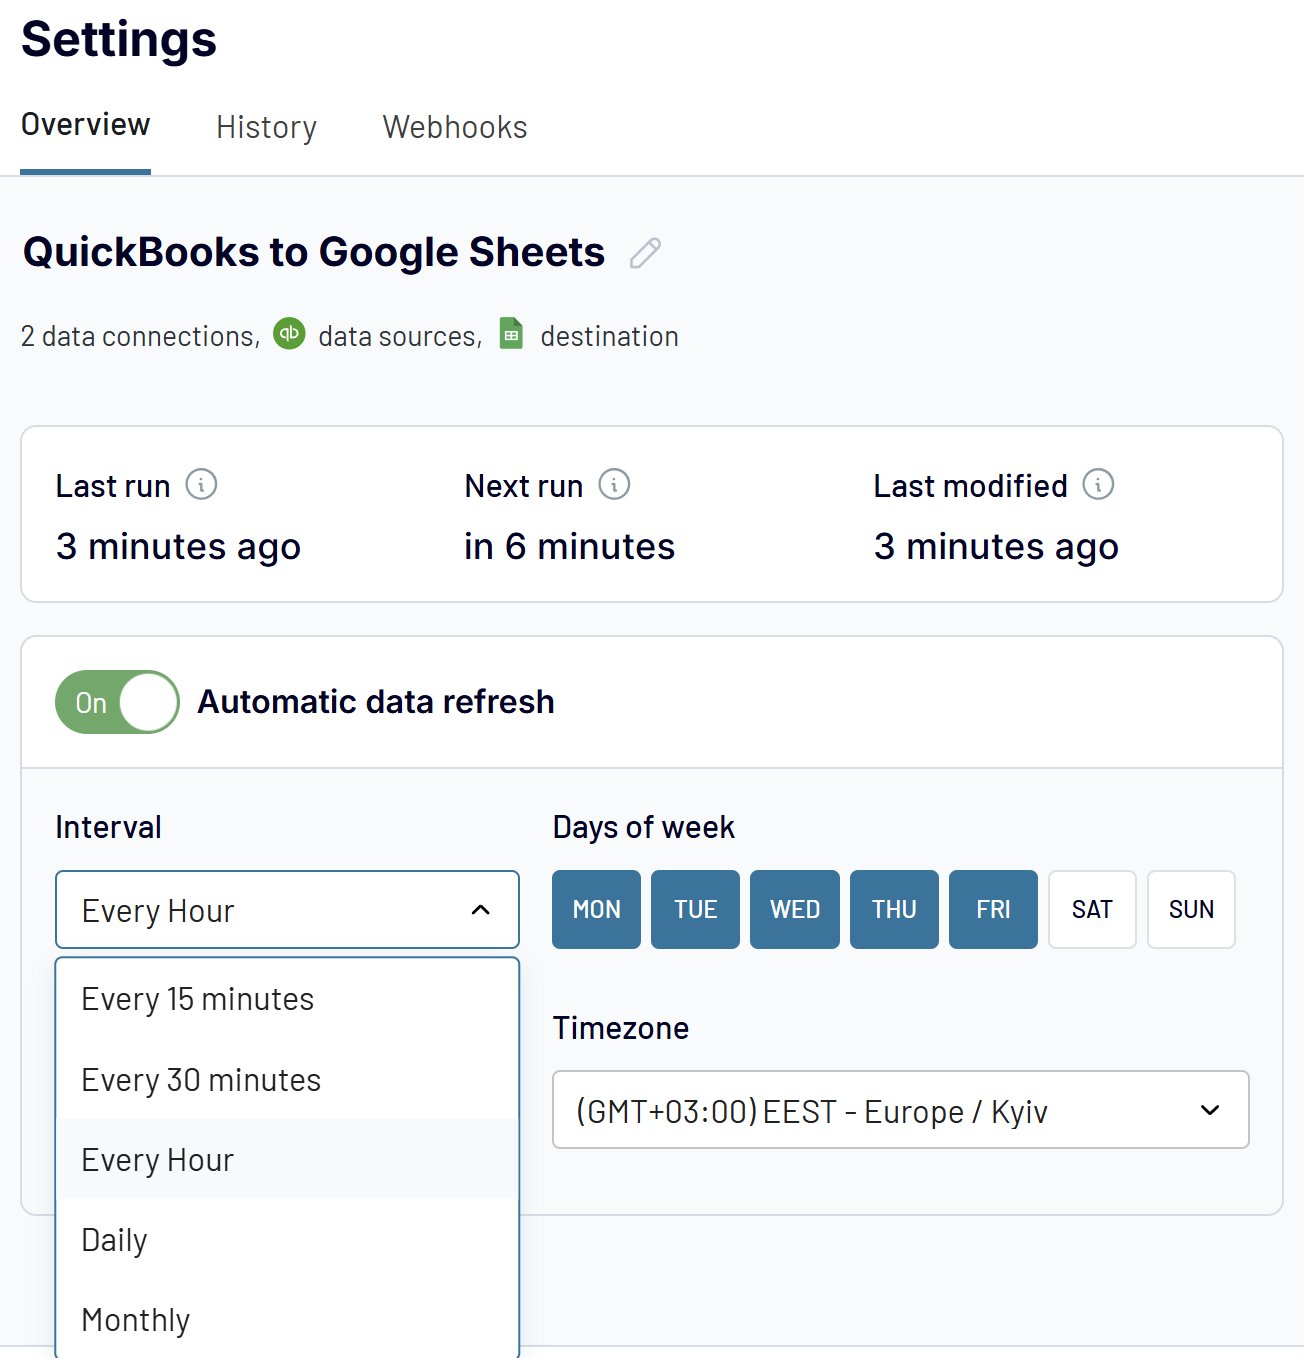
Once you've clicked Save and Run, the data from QuickBooks will be loaded into the chosen spreadsheet and you'll find yourself in the Flow settings tab. Here you can enable the automatic data refresh and
- Select your preferred refresh interval (from monthly to every 15 minutes).
- Choose specific days of the week and times for updates
- Set your preferred time zone to align with your business hours
Once configured, your QuickBooks data will automatically flow into Google Sheets according to your schedule. This ensures you always have the most up-to-date financial information at your fingertips without having to manually export data.
What QuickBooks use cases can Coupler.io handle
Beyond simply connecting QuickBooks to Google Sheets, Coupler.io serves as a data connector to enable financial workflows and analysis. Here are the key use cases Coupler.io handles:
Multi-entity financial consolidation
For businesses managing multiple subsidiaries, divisions, or legal entities, Coupler.io automatically aggregates financial data from multiple QuickBooks accounts into centralized dashboards. No manual data compilation and consolidation errors.
Business impact: Reduce the month-end close from days to hours while maintaining accuracy across all entities.
Revenue operations and metrics tracking
SaaS and subscription businesses can transform QuickBooks financial data into actionable revenue intelligence. Track annual recurring revenue (ARR) trends, monitor customer lifetime value, analyze churn patterns, and create predictive models for customer retention. Coupler.io connects your financial data with the metrics that matter most for growth-focused businesses.
Business impact: Identify successful revenue patterns, reduce churn proactively, and improve forecasting accuracy for better strategic planning.
Sales performance and commission tracking
Bridge the gap between QuickBooks financial data and CRM systems by combining deal data with actual payment records. Calculate accurate commissions based on collected revenue (not just booked sales), map sales territories to financial performance, and create comprehensive sales funnel analysis from lead to cash collection. Works seamlessly when connecting QuickBooks with HubSpot, Salesforce, or other CRM platforms.
Business impact: Eliminate commission disputes with transparent calculations and understand true sales efficiency based on actual financial outcomes.
Multi-client standardized reporting
Accounting firms and bookkeeping services can create standardized reporting frameworks across diverse client QuickBooks instances. Generate consistent report formats regardless of each client's chart of accounts, maintain client-specific customizations while enabling cross-client analysis, and create centralized dashboards showing key metrics across your entire client portfolio.
Business impact: Handle more clients without proportional staff increases, deliver consistent professional reporting, and provide superior insights with faster turnaround times.
Cash flow forecasting and management
Transform your QuickBooks data into intelligent cash flow predictions by integrating banking, receivables, and payables information. Predict cash needs based on historical patterns and upcoming obligations, run scenario planning for different growth assumptions, and automate cash position monitoring to avoid shortages.
Business impact: Avoid cash shortages and associated penalties, make informed decisions about capital allocation, and reduce time spent on manual cash flow analysis.
These use cases demonstrate how Coupler.io extends beyond basic data export to enable strategic financial management, whether you're loading data to Google Sheets, BI tools, data warehouses, or AI platforms.
Prebuilt templates
Coupler.io gives you flexibility in how you work with QuickBooks data. You can build custom data flows from scratch, configuring every detail to match your specific needs, or jumpstart your analysis with prebuilt templates that deliver instant insights.
For those who need quick, professional-quality reports without the setup work, Coupler.io offers two types of ready-to-use solutions:
- Data set templates that provide clean, analysis-ready data with pre-configured metrics and transformations.
- Dashboard templates that visualize your QuickBooks data through interactive charts and reports.
Both eliminate hours of manual work organizing financial data and calculating metrics, letting you focus on analysis rather than data preparation.
Data set templates for QuickBooks
Data set templates are ready-made reporting solutions designed by Coupler.io's data analysts for common QuickBooks scenarios. These templates come pre-configured with the right data sources, transformations, and key metrics, so you can go from raw QuickBooks data to actionable insights instantly—no complex calculations or manual data blending required.
Available QuickBooks data set templates:
- Monthly profit and loss analysis with QuickBooks data - View current and previous month P&L totals to monitor income, costs, and earnings by category
- Annual profit and loss analysis for business growth insights - Review 12-month financial performance including profit trends and detailed revenue/expense breakdowns
- Understanding your company's financial position with balance sheet analysis - Get clear view of assets, liabilities, and equity with 12-month balance sheet reporting
- Annual general ledger analysis for comprehensive financial oversight - Overview company financial activity over the past year, segmented by account and transaction type
- Tracking business transactions for audits and financial reviews - Monitor all financial transactions across 12 months to support audits and detailed reconciliations
- Invoice management and cash flow optimization strategies - Track invoice status, payment progress, and outstanding balances to improve billing performance
- Customer-level sales analysis for strategic planning - Understand annual revenue per customer to identify top clients and shape sales strategy
- Cash flow comparison analysis for operational finance management - Compare current and previous month cash flow to monitor liquidity and manage operational finances
- Annual cash flow analysis by category for financial planning - Analyze yearly cash flow patterns across key categories to understand spending trends
- Annual profit and loss analysis by category for business health assessment - Assess business financial health by reviewing income, expenses, and net profit across categories
- Detailed monthly profit and loss comparison for performance monitoring - Compare detailed P&L records between current and previous months to track profitability
- Comprehensive annual profit and loss breakdown for strategic insights - Gain detailed breakdown of yearly income and expenses with profitability metrics
- QuickBooks account structure analysis for consistent categorization - Review chart of accounts by classification and type to ensure consistent financial categorization
- Annual product sales analysis for strategic planning - Evaluate yearly product performance by analyzing revenue, quantity sold, and category trends
- Bills management and payables optimization with QuickBooks - Track outstanding and paid bills by vendor to manage payables and maintain healthy cash flow
- QuickBooks invoice and item-level analysis for billing optimization - Analyze invoices with item-level data to monitor billing status and product-specific performance
- QuickBooks monthly cash flow analysis by category - Review current month cash inflows and outflows to assess operational liquidity
- QuickBooks monthly profit and loss performance review - Review current month income and expense performance grouped by financial categories
- Annual financial activity analysis without profit metrics - Analyze detailed yearly financial activity excluding profit figures, grouped by classification
- Annual profit and loss summary without class segmentation - Review account-level yearly financial performance without class breakdown
Financial dashboard
The QuickBooks financial dashboard delivers a complete view of your company's financial performance, combining profit and loss tracking, balance sheet analysis, cash flow monitoring, and bank account summaries in one place. It provides the financial insights needed to monitor profitability, understand your company's financial position, and manage liquidity effectively.
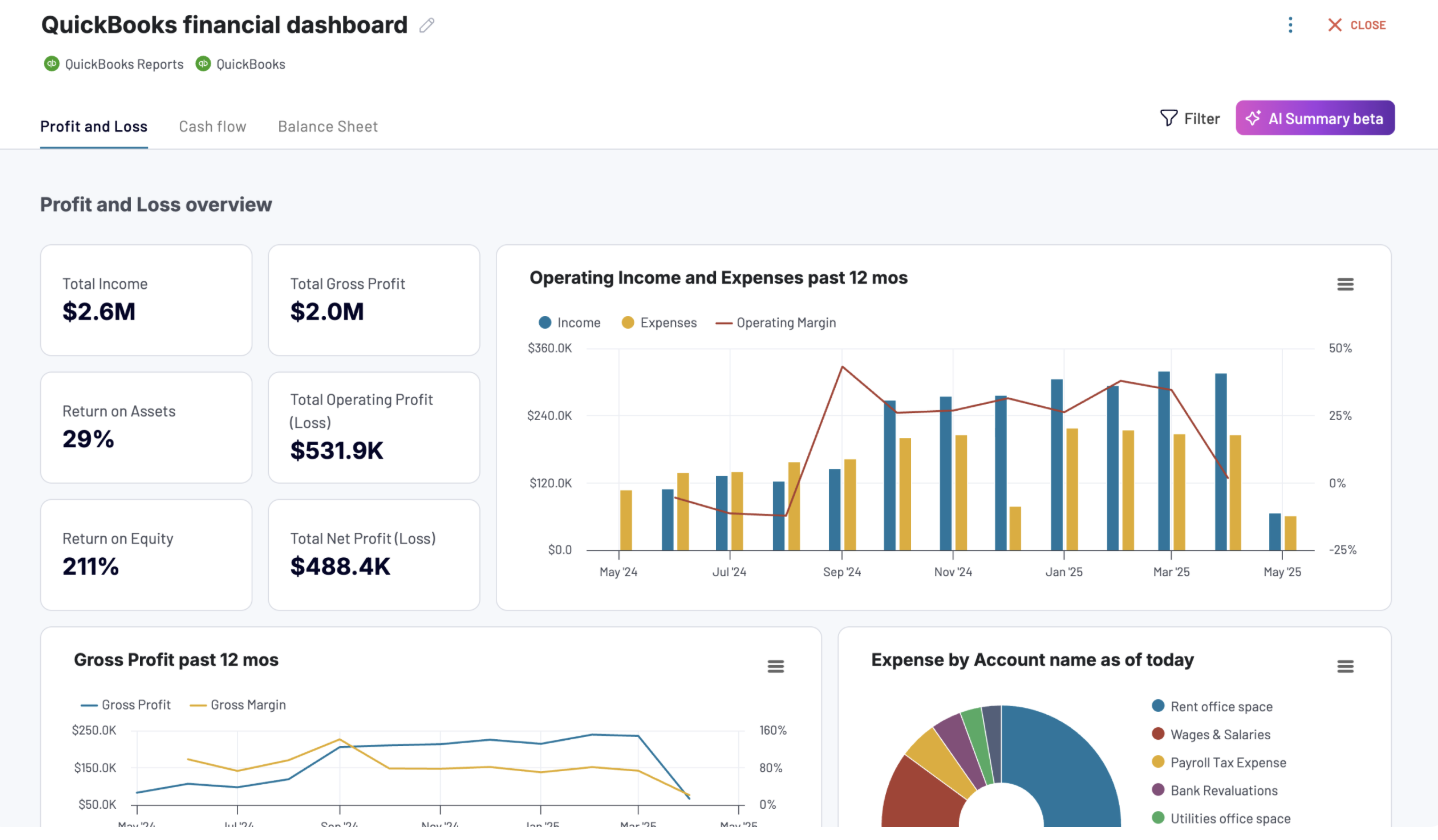
Key insights provided:
- Profit and loss summaries showing revenue, expenses, and net income for the last month, month to date, and year to date with visual trend comparisons
- Balance sheet snapshots displaying assets, liabilities, and equity with period-over-period change tracking
- Cash flow visualization highlighting net cash changes, end-of-period cash position, and cash movement patterns
- Bank and cash account balances across all linked accounts with multi-currency breakdowns for international transactions
How to use: This dashboard is available in Coupler.io with built-in AI insights, as well as templates for Google Sheets and Looker Studio. Connect your QuickBooks account through the built-in connector, and the dashboard automatically populates with your data.
Revenue dashboard
The revenue dashboard helps you monitor income and expenses while analyzing revenue distribution by customers and products. It reveals which clients and offerings drive your business, enabling data-driven decisions about marketing focus, customer retention, and product strategy.
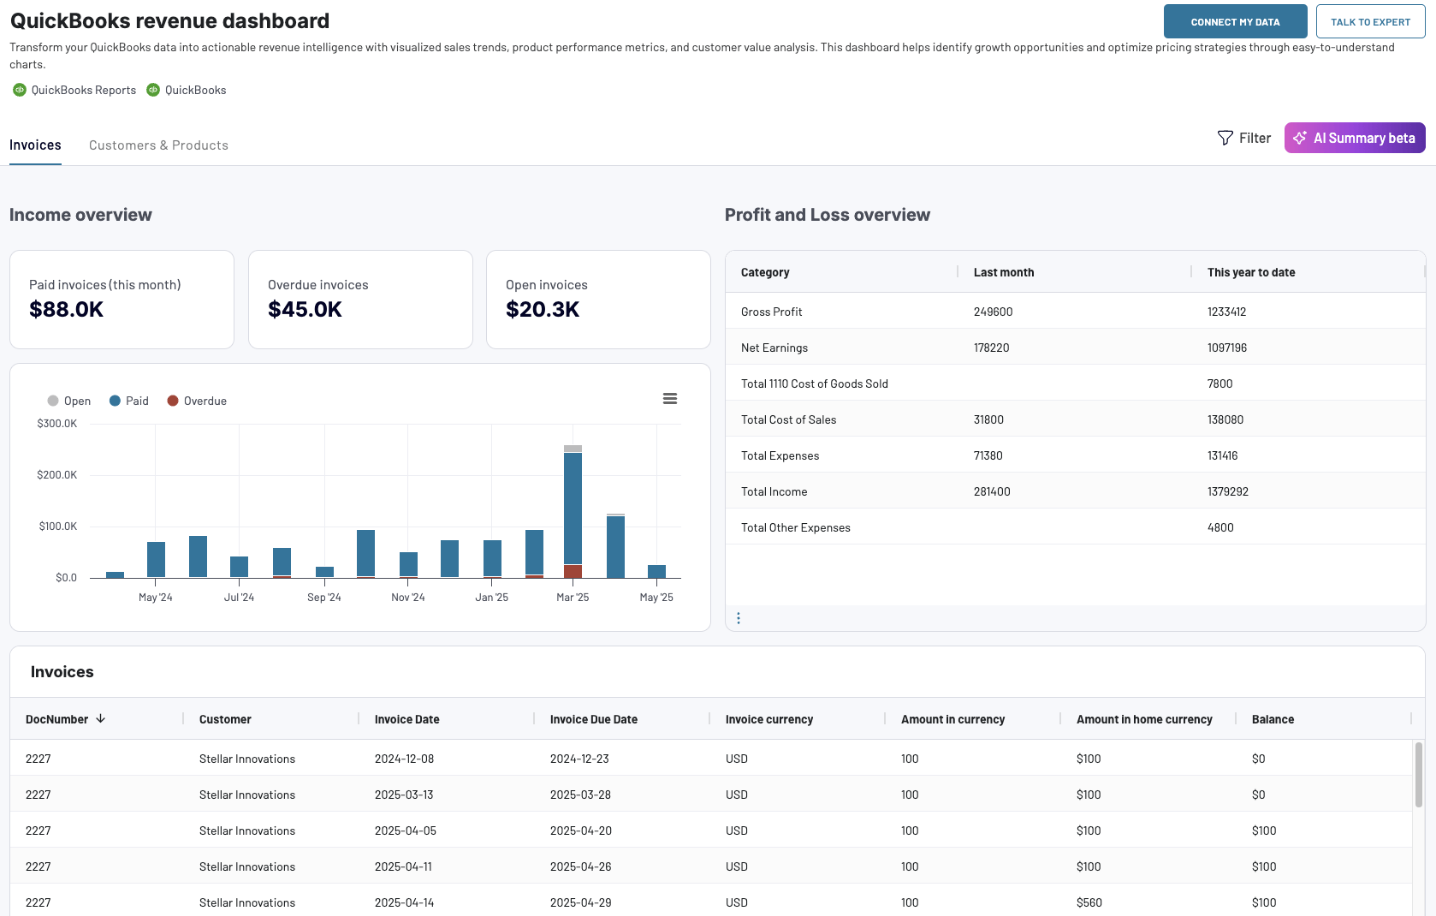
Key insights provided:
- Overall revenue trends for the last 12 months to identify seasonal fluctuations, peak periods, and unexpected changes
- Profit and loss overview comparing revenue against expenses to assess cost management effectiveness
- Customer analysis revealing your most valuable clients by revenue contribution for targeted relationship management
- Product performance metrics showing which offerings generate the most revenue for inventory and sales optimization
How to use: This dashboard is available in Coupler.io with built-in AI insights, plus templates for Google Sheets, Looker Studio, and Power BI. Navigate to the Readme tab inside the template for step-by-step setup instructions with your QuickBooks data.
Accounts payable dashboard
The accounts payable dashboard provides visibility into payment obligations, helping you understand who your main creditors are and prioritize vendor payments effectively. It enables better cash flow management by showing both your payment commitments and available funds across accounts.
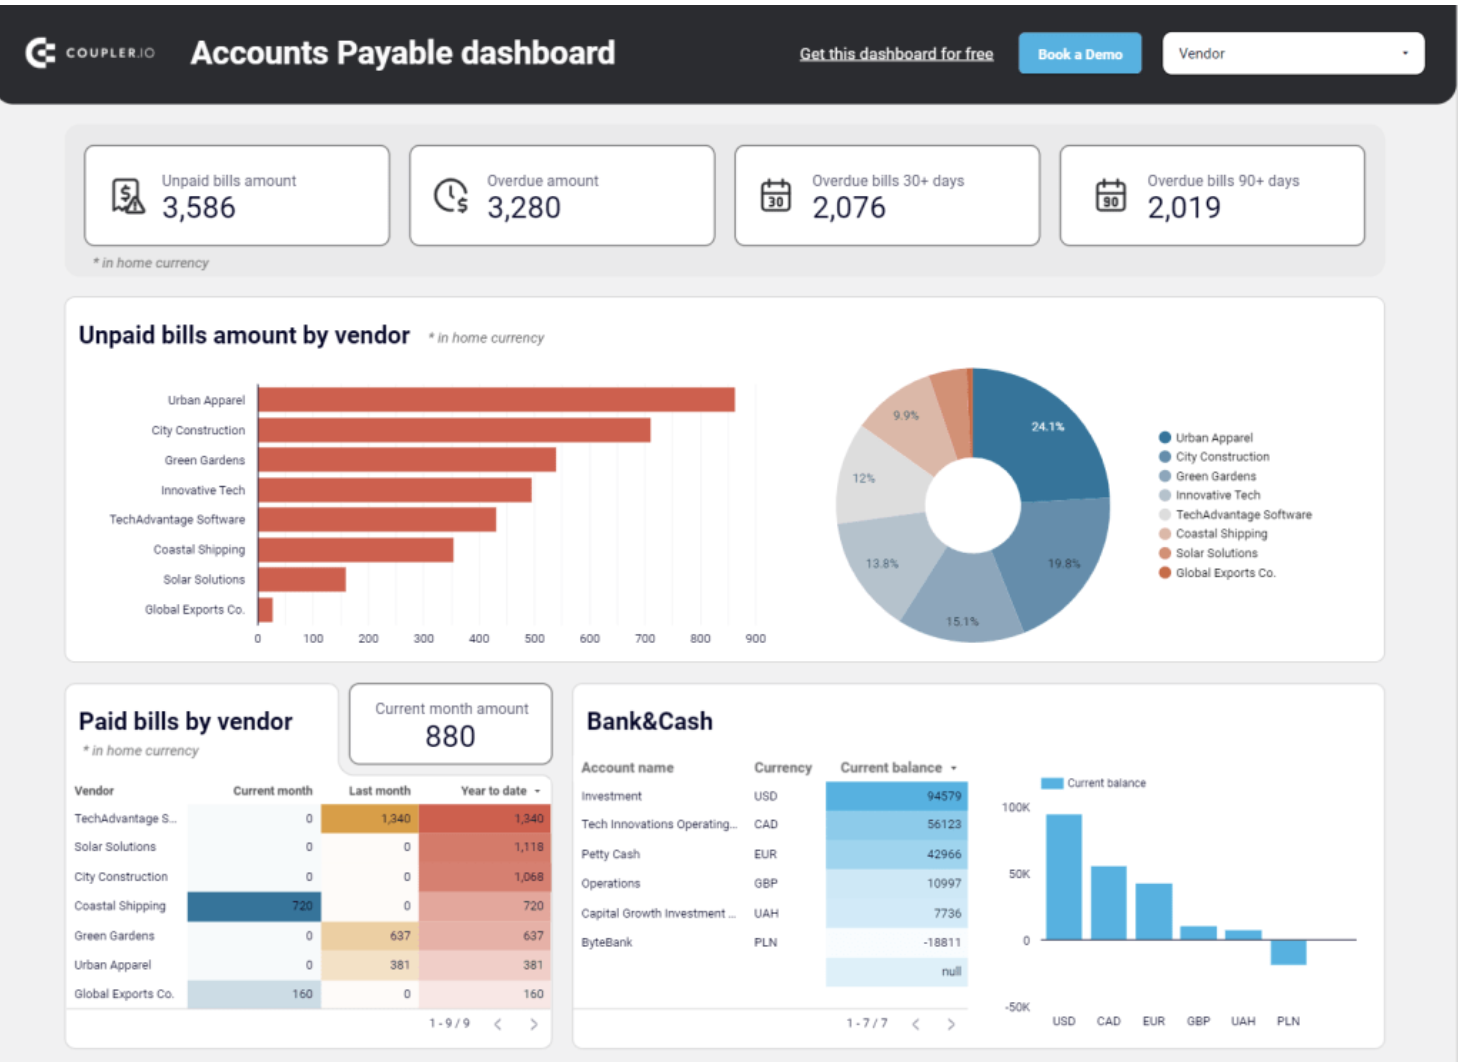
Key insights provided:
- Unpaid and overdue bill amounts in your home currency with top 10 vendors ranked by credit debt
- Complete vendor share analysis showing each supplier's portion of your total accounts payable
- Paid bills history for evaluating vendors by payment amounts and making prioritization decisions
- Bank and cash balances by accounts and currency to assess payment capacity
- Aging analysis breaking down overdue amounts by vendor across current, 30-day, 60-day, 90-day, and 90+ day periods
- Detailed vendor bills table covering the last 12 months across all currencies
How to use: This dashboard is available as a template in Google Sheets and Looker Studio. Click the Readme tab in the template and follow the setup guide to connect your QuickBooks account through Coupler.io.
Accounts receivable
The accounts receivable dashboard offers clear visibility into outstanding customer payments, showing who owes you money and enabling strategic decisions about collection activities. It helps prevent cash gaps by highlighting payment priorities and tracking customer payment behavior over time.
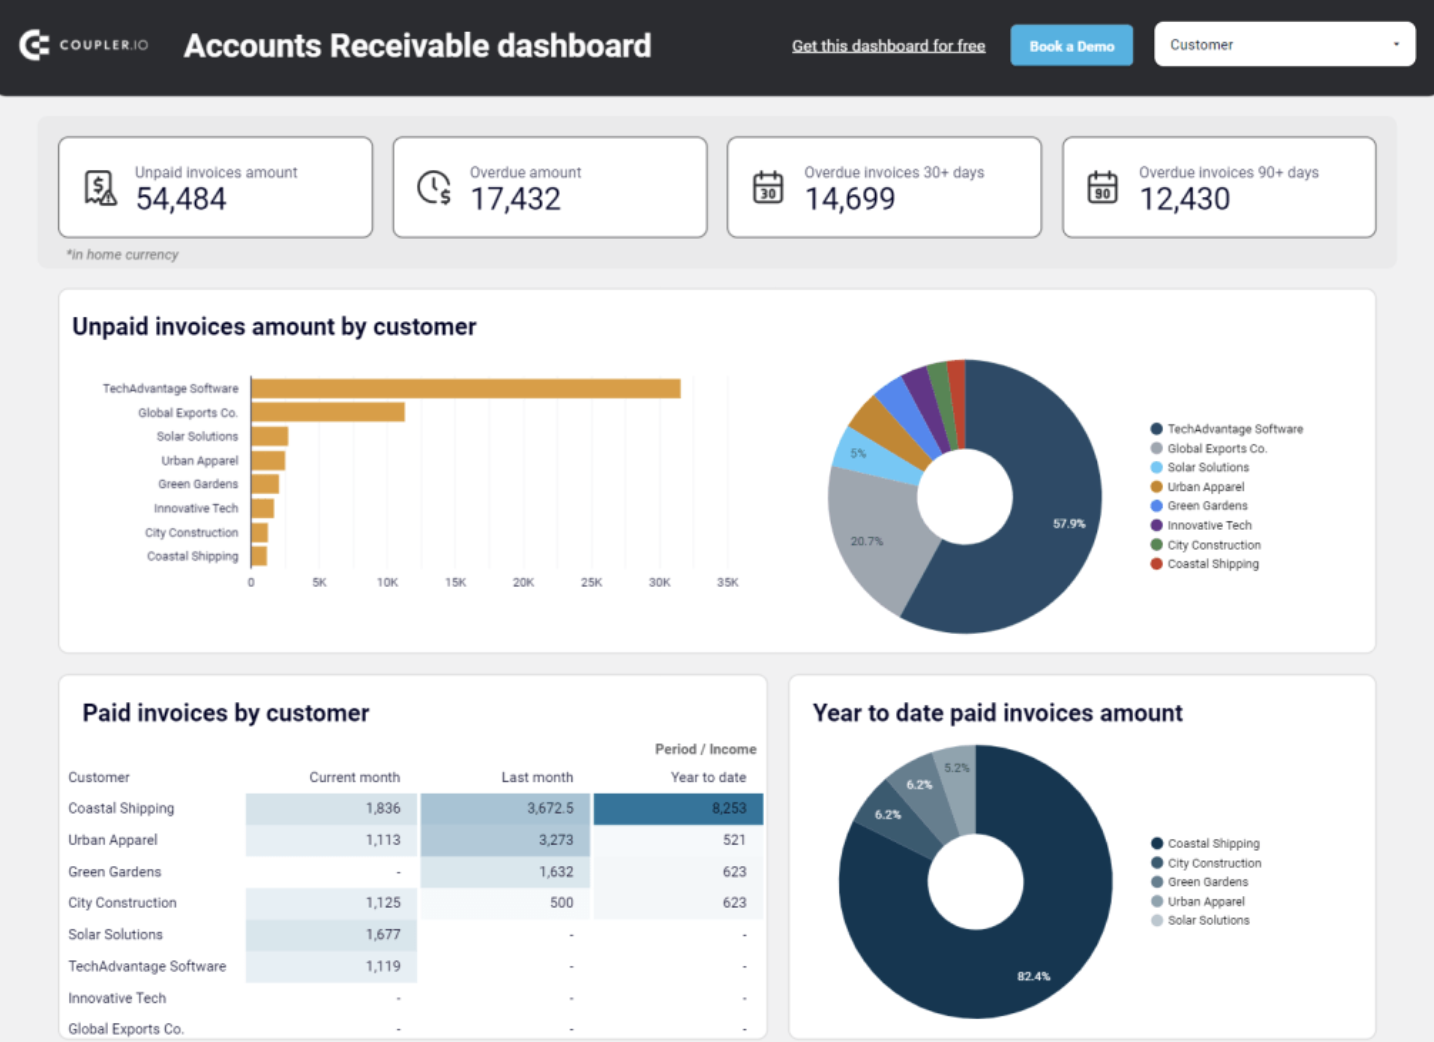
Key insights provided:
- Unpaid and overdue invoice amounts in your home currency with top 10 customers ranked by outstanding balance
- Customer share analysis showing each client's portion of your total accounts receivable
- Paid invoice history for evaluating customer payment patterns and deciding on collection strategies
- Monthly invoice dynamics tracking both paid and unpaid invoices to spot trends
- Aging analysis breaking down overdue amounts by customer across current, 30-day, 60-day, 90-day, and 90+ day periods
- Comprehensive customer invoices table covering the last 12 months across all currencies
How to use: This dashboard is available as a template in Google Sheets and Looker Studio. Navigate to the Readme tab to find step-by-step instructions for connecting your QuickBooks account via Coupler.io and setting up automated data refresh.
How much does it cost to send QuickBooks reports to Google Sheets?
To send QuickBooks data to Google Sheets, you'll need a data integration solution. Google Sheets itself is free as part of Google Workspace (or available standalone), making it an accessible option for businesses of all sizes.
Coupler.io provides the integration layer with flexible pricing based on your connection needs and refresh frequency.
The combination of free Google Sheets and automated data integration eliminates the time spent on manual exports while keeping your financial reports up to date.
Coupler.io pricing tiers
Coupler.io offers several pricing tiers to accommodate different business needs:
- Free forever plan: includes 1 data connection and 1 user
- Personal plan: $24/mo for 5 data connections and 1 user
- Professional plan: $99/mo for 25 data connections and 5 users
- Team plan: $199/mo for 100 data connections and 10 users
- Business plan: $449/mo for 400 data connections and unlimited users
All plans include the QuickBooks integration, with differences in refresh frequency, number of live data flows, and additional features. Annual billing provides significant discounts compared to monthly payments.
The true value comes from the combination of time savings, error reduction, and improved decision-making that automated financial reporting enables. When viewed through this lens, connecting QuickBooks to Google Sheets is an investment that typically pays for itself many times over.
FAQs
Can I connect QuickBooks Online directly to Google Sheets?
QuickBooks Online doesn't offer a native direct integration with Google Sheets. However, Coupler.io provides a seamless connection that functions as if it were native, with automated data flows and scheduled refreshes.
What are the benefits of connecting QuickBooks to Google Sheets with Coupler.io?
Connecting QuickBooks to Google Sheets with Coupler.io offers numerous advantages that transform how you work with your financial data:
| Benefit | Description | Business Impact |
|---|---|---|
| No-Code Solution for Everyone | Requires no technical expertise, coding knowledge, or SQL with simple point-and-click configuration, clear step-by-step guidance, and visual data transformation tools | Accountants, bookkeepers, and business owners can create powerful data connections without involving IT resources |
| Automated Data Synchronization | Schedule automatic data refresh with custom schedules (as frequent as every 15 minutes), ensuring your spreadsheet sync operates on your preferred timeline with always current financial data | Eliminates manual export reports and import data processes, saving hours of tedious work each month and reducing error risk |
| Rich Data Transformation Capabilities | Transform QuickBooks data during the import process by using dropdown selections to rename/hide columns, apply filters, create calculated fields, and sort/aggregate data | Data arrives in Google Sheets ready for analysis, without requiring additional cleanup or manipulation |
| Ready-to-Use Dashboard Templates | Access professionally designed financial dashboards including cashflow analysis, revenue tracking, purchase order monitoring, and accounts receivable management | Gives you an immediate starting point for visualizing financial data, saving hours of dashboard development time |
What QuickBooks data can I import into Google Sheets?
With Coupler.io, you can import virtually any QuickBooks data entity, including accounts, invoices, bills, customers, vendors, payments, expenses, profit and loss reports, balance sheets, and custom reports. This comprehensive access ensures you can analyze any aspect of your financial data in Google Sheets.
- Account - Account data provides a comprehensive view of all your financial accounts, including bank accounts, credit cards, and asset accounts. This data lets you track financial transactions, manage budgets, and prepare accurate financial reports.
- Attachable - Attachable data includes files and documents linked to your QuickBooks Online records, such as receipts, invoices, and contracts.
- Bill - Bill data encompasses all vendor bills, including details about the vendor, amounts, due dates, and payment statuses. This information allows you to manage payables, track expenses, and ensure timely payments to vendors.
- BillPayment - BillPayment data includes records of payments made towards vendor bills. This data is essential for maintaining accurate accounts payable records and tracking cash outflows.
- Budget - Budget data consists of financial plans and projections for various categories and time periods, allowing you to compare actual performance against planned targets.
- Class - Class data allows you to categorize transactions by department, location, or other segments, helping you analyze financial performance across different areas of your business.
- CompanyInfo - This data includes essential details about your business, such as company name, address, and contact information for reporting purposes.
- CreditMemo - CreditMemo data consists of issued credits to customers for returns or refunds, important for managing customer accounts and maintaining accurate sales records.
- Customer - Customer data includes information about all your customers, such as names, contact details, and transaction histories for relationship management and sales analysis.
- Department - Department data helps you segment financial data by different business units or divisions for detailed financial analysis at a departmental level.
- Deposit - Deposit data includes records of funds deposited into your bank accounts, helping reconcile bank statements and ensure accurate financial reporting.
- Employee - Employee data covers information about your staff, including names, contact details, and payroll information for managing payroll and tracking labor costs.
- Estimate - Estimate data consists of price quotes provided to customers for potential sales, useful for tracking potential revenue and managing sales pipelines.
- ExchangeRate - ExchangeRate data includes information on currency conversion rates used in transactions, crucial for businesses dealing with multiple currencies.
- Invoice - Invoice data encompasses all sales invoices issued to customers, including details about products, services, amounts, and payment terms for managing receivables and tracking sales.
- Item - Item data includes information about your products and services, such as descriptions, prices, and inventory levels for inventory management and pricing strategies.
- JournalEntry - JournalEntry data consists of manual entries made to the general ledger, including debits and credits for various accounts to ensure accurate financial records.
- JournalCode - JournalCode data includes specific codes used to categorize journal entries for maintaining organized financial records.
- Payment - Payment data includes records of payments received from customers, essential for managing receivables and tracking cash inflows.
- PaymentMethod - PaymentMethod data consists of the various methods customers use to make payments, such as credit cards, bank transfers, or cash.
- Preferences - Preferences data includes customized settings and configurations within QuickBooks to ensure your preferred settings are documented.
- Purchase - Purchase data covers records of goods and services bought from suppliers for tracking expenses and managing supplier relationships.
- PurchaseOrder - PurchaseOrder data consists of orders placed with suppliers for goods and services, allowing you to track orders and manage inventory.
- RefundReceipt - RefundReceipt data includes records of refunds issued to customers for managing customer accounts and tracking refund transactions.
- SalesReceipt - Sales receipt data includes records of sales transactions completed at the point of sale for tracking daily sales and managing cash flow.
- TaxAgency - TaxAgency data includes information about tax authorities you deal with for accurate tax reporting and compliance.
- TaxCode - TaxCode data consists of the various tax rates and codes used in your transactions for accurate tax calculations and reporting.
- TaxRate - TaxRate data includes the specific tax rates applicable to your sales and purchases for compliance and accurate financial reporting.
- Term - Term data includes the payment terms agreed upon with customers and suppliers, such as net 30 or net 60 days, for managing cash flow.
- TimeActivity - TimeActivity data includes records of hours worked by employees or billed to customers for payroll processing, job costing, and invoicing.
- Transfer - Transfer data consists of records of funds transferred between your accounts for managing cash flow and reconciling accounts.
- Vendor - Vendor data includes information about your suppliers, such as names, contact details, and transaction histories for managing supplier relationships.
- VendorCredit - VendorCredit data consists of credits received from suppliers for returns or adjustments to help manage payables.
What QuickBooks reports can you export with Coupler.io?
With Coupler.io, you can automate the export of numerous QuickBooks standard reports, ensuring your financial data stays current without manual downloads. Here are the key reports available:
- Account List Details - A comprehensive overview of all your financial accounts, including account types, balances, and descriptions for managing your chart of accounts.
- AP Aging Detail - Shows unpaid vendor bills categorized by days overdue, helping you manage accounts payable and track outstanding liabilities.
- AP Aging Summary - A summarized view of unpaid vendor bills grouped by aging periods (0-30 days, 31-60 days, etc.) for quick payables assessment.
- AR Aging Detail - Lists outstanding customer invoices categorized by days overdue, essential for managing accounts receivable and collection efforts.
- AR Aging Summary - Provides a summarized view of outstanding invoices grouped by aging periods for quick receivables overview.
- Balance Sheet - Presents a snapshot of your business's financial position with assets, liabilities, and equity, essential for understanding financial health.
- Balance Sheet Comparison - Compares balance sheets across different periods to identify trends in your financial position over time.
- Balance Sheet Detail - An expanded version of the balance sheet with detailed account breakdowns and transaction-level information.
- Cash Flow Statement - Tracks cash movements in and out of your business across operating, investing, and financing activities.
- Customer Balance Detail - Shows detailed transaction history for each customer, including invoices, payments, and current balances.
- Customer Balance Summary - Provides a high-level view of customer balances without transaction details.
- General Ledger - A complete record of all financial transactions posted to your accounts, serving as the foundation for all financial reporting.
- Inventory Valuation Summary - Shows the value of your inventory with quantities and costs for each item.
- Profit and Loss - Displays revenue, expenses, and net income over a specific period to assess business profitability.
- Profit and Loss Comparison - Compares P&L statements across different periods to analyze performance trends.
- Profit and Loss Detail - An expanded P&L with transaction-level details for each income and expense line item.
- Sales by Customer Summary - Breaks down total sales by customer, helping identify your most valuable clients.
- Sales by Product/Service Summary - Shows sales performance by individual products or services to understand what drives revenue.
- Trial Balance - Lists all accounts with their debit and credit balances, used to verify that total debits equal total credits.
- Vendor Balance Detail - Shows detailed transaction history for each vendor, including bills, payments, and outstanding balances.
- Vendor Balance Summary - Provides a high-level view of vendor balances without transaction details.
How often can I refresh my QuickBooks data?
Coupler.io allows you to refresh your data as frequently as every 15 minutes, ensuring near real-time access to your financial information. You can customize the schedule based on your business needs, from hourly to daily, weekly, or monthly updates.
Can bookkeepers and accountants use this setup?
Yes, this solution is ideal for accounting professionals managing multiple clients. Coupler.io enables them to create standardized reports, build custom dashboards, share insights without granting QuickBooks access, and automate routine reporting. Many accountants use this approach to differentiate their services and deliver more strategic value to clients.
Is the QuickBooks to Google Sheets integration secure?
Yes, Coupler.io prioritizes security by using OAuth 2.0 for authentication, transferring data without storage, providing granular permissions, and complying with data protection regulations. Your financial data remains protected throughout the entire integration process.
Does Coupler.io provide templates for dashboards?
Yes, Coupler.io offers ready-to-use templates specifically designed for QuickBooks data, including financial dashboards, revenue analysis, accounts payable/receivable tracking, and custom business templates. These provide an immediate starting point for your financial analysis, saving significant development time.